China’s Top Ports: An Index for Importers and Exporters

China has numerous ports along its eastern and southern coasts – 158 in total. While Shanghai often steals the attention as the largest port in China (and the busiest in the world), there are a number of other locations that foreign traders can look into. Moreover, as ports vary in size, accessibility, growth, and preferential policies, different options may better suit different needs.
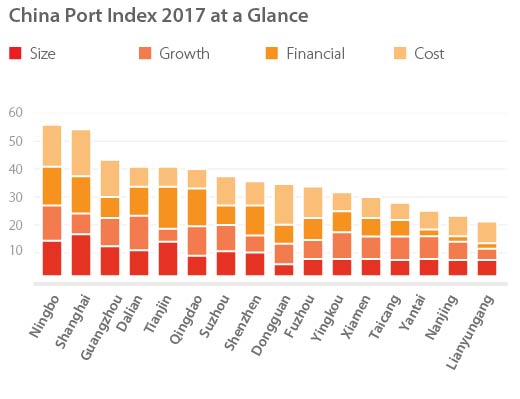
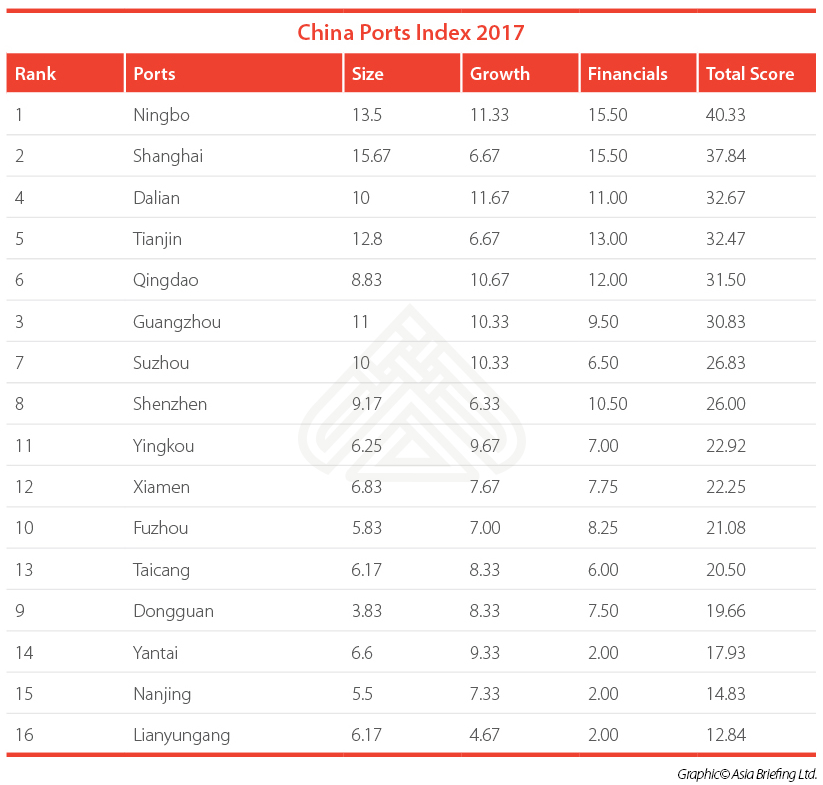
Using our Ports Index – a metric focused on size, growth, and financials – we evaluate and rank 16 of China’s top ports in this article. Additionally, we make predictions about how China’s ports may develop in the future and what investors can expect.
The China Ports Index 2017 methodology
Port selection
16 ports were selected for the Index based on their global importance and growing relevance in the domestic market. The 12 Chinese ports ranked within the International Association of Ports and Harbor’s (IAPH) 2016 list of 50 ports with the most traffic were included, as well as four up-and-coming ports that displayed fast growth and cargo handling capacity in recent years.
These ports all play import roles in developing China’s economy, and are all close to free trade zones (FTZs), which increases access to preferential policies and logistics.
Scoring
Scoring is based on statistical data. In order to combine all the different data into one simplified and much more readable table, a sequential scoring method was applied.
Within each variable column, the 16 ports were compared against each other. The best performing port under that variable would receive a score of 16, with the lowest performer receiving a score of one.
The Index contains three main categories: size, growth, and financials. The variable scores within each category are aggregated to produce an overall average weighted score. The sums of all the average weighted scores under the three categories generate the final scores and rankings of the 16 cities in this report.
Data sources
We gathered data from official government port websites, stock market performance in various cities published by the Shanghai, Shenzhen, and Hong Kong Stock Exchange, news from major Chinese media about traffic data, and various professional port, shipping, and overall logistics websites.
Findings
As the largest port, Shanghai ranks high at number two on the Index. However, Ningbo, a smaller but still major port and industrial hub in neighboring Zhejiang province to the south of Shanghai, takes first place. Guangzhou, Dalian, Tianjin, and Qingdao appear at the top of the Index, with steady performance throughout.
Readers should keep in mind that many of the lesser-known ports listed above have recently experienced fast development with the aid of supportive government policies. Therefore, while these ports rank low for this year, it is likely that they will climb next year.
Size scoring
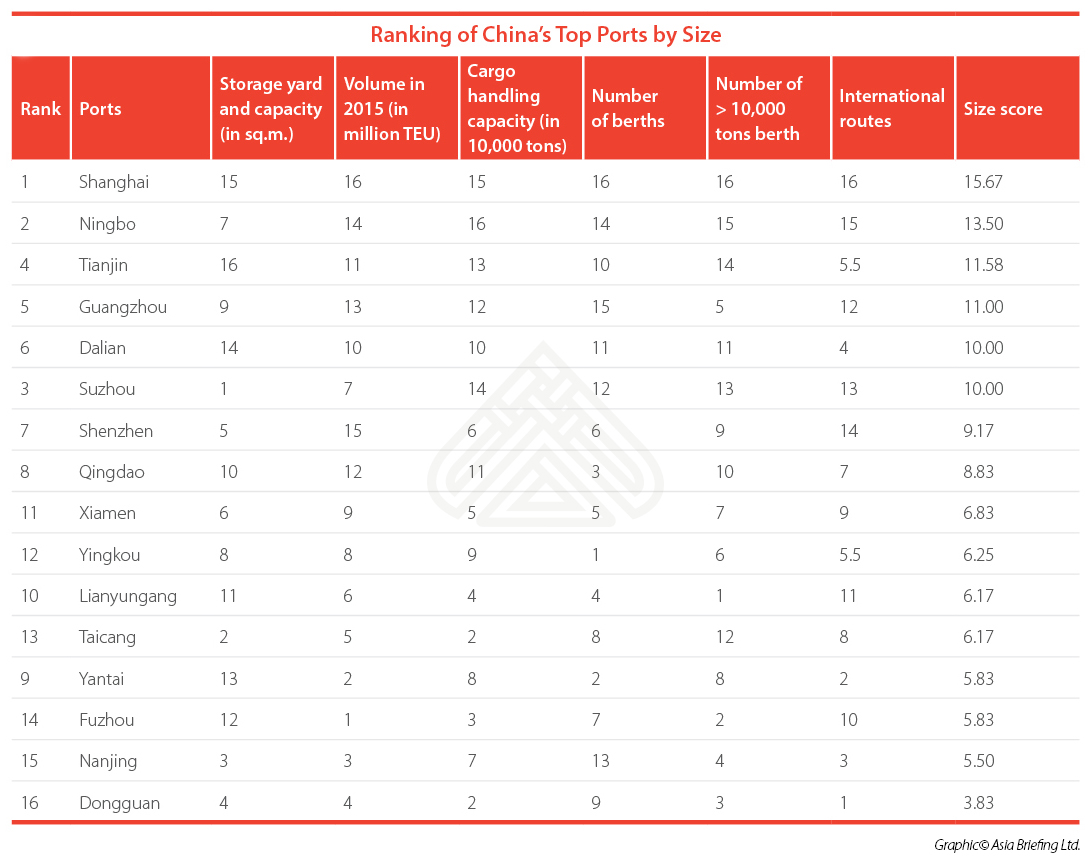
Size indicators reflect the natural advantages of the port itself. The top five ports for size are Shanghai, Ningbo, Tianjin, Guangzhou, and Dalian.
Unsurprisingly, these five ports specialize in large transit and storage of bulk-size products and raw minerals including chemicals, iron ore, oils, grain, and coal. Tianjin and Dalian, in the north of China, serve the industrial base there, while Guangzhou in the south serves the manufacturing base.
Shanghai and Ningbo serve the unique advantage in the east with advanced shipping logistics services, solid commodities transit reserve transactions, and strong regional economic support.
The variables included for the size scoring include various measurements of physical port size. “International routes” was also included to give measurement as to the global reach and connectivity of the port. Under “international routes”, southern ports performed well due to their comparable advantages in foreign trade.
Tianjin, Dalian, and Dongguan underperformed in this area. Traditionally, Tianjin is gradually becoming more international, while Dalian’s industry is still heavily dependent on traditional heavy industries such as coal, and high value-added industries are rare.
Meanwhile, Dongguan is close to Hong Kong, and that synergy means that Dongguan has less of a need to develop its own international routes.
Growth scoring
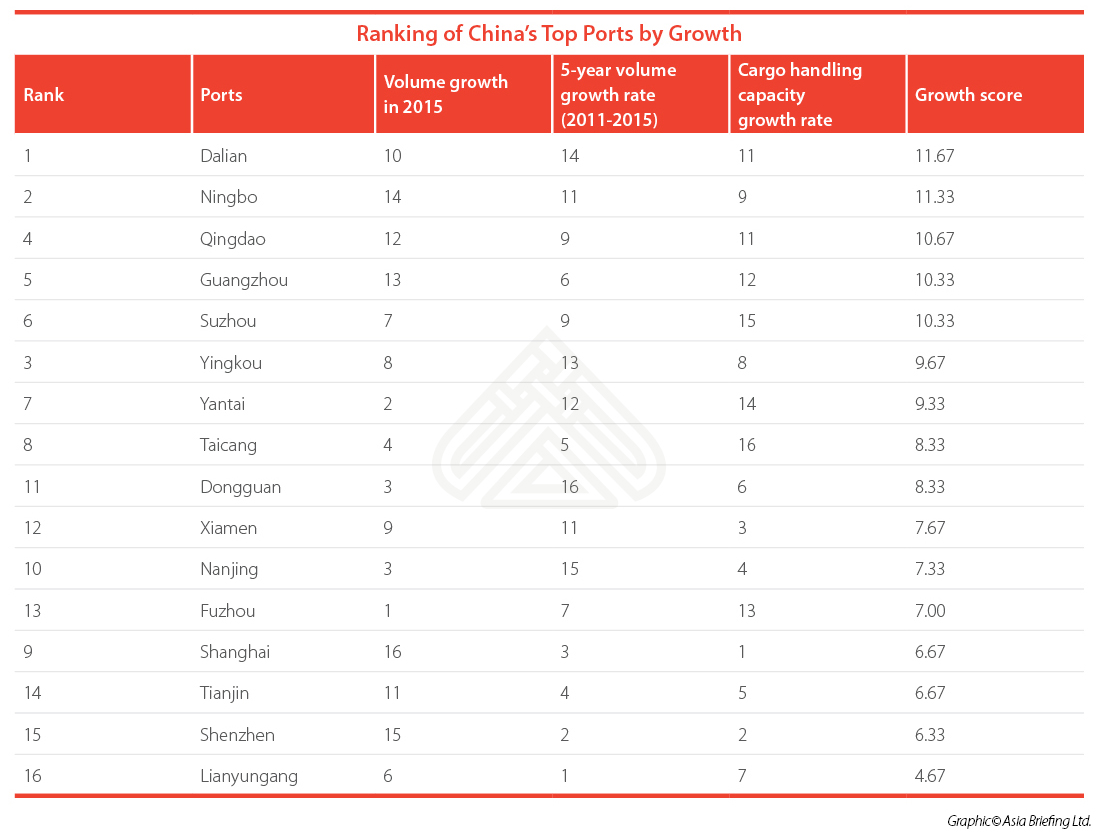
Despite dependence on heavy industrial trade, Dalian ranked as the top port for growth. Looking forward, the establishment of the Liaoning FTZ will likely bring more business to port bonded business and international transit. For example, car importers in the FTZ in Dalian will benefit from delayed tariff payment benefits and reduced financial costs. Meanwhile, Dalian will also have access to international aquatic products with an international transit permit for the cold-chain business.
Ningbo and Suzhou also performed well. Ningbo grew fast and steadily, likely due to its large iron ore transshipment and oil transport base. Ningbo also has a domestic liquid chemical storage base and serves as a critical port for east China’s coal, grain storage, and transportation. Ningbo’s cargo throughput has ranked “world-first” for seven consecutive years.
Suzhou, the dark horse and the busiest inner river port, over-performed. The ports of Taicang and Suzhou, including the ports of Changshu, and Zhangjiagang, have flourished through a strategy of developing inland trade.
Shanghai, Tianjin, and Shenzhen ranked low for growth as they are already quite developed, and a one percent growth would mean a substantial increase in volume and handling capacity than for the smaller ports.
Financial scoring
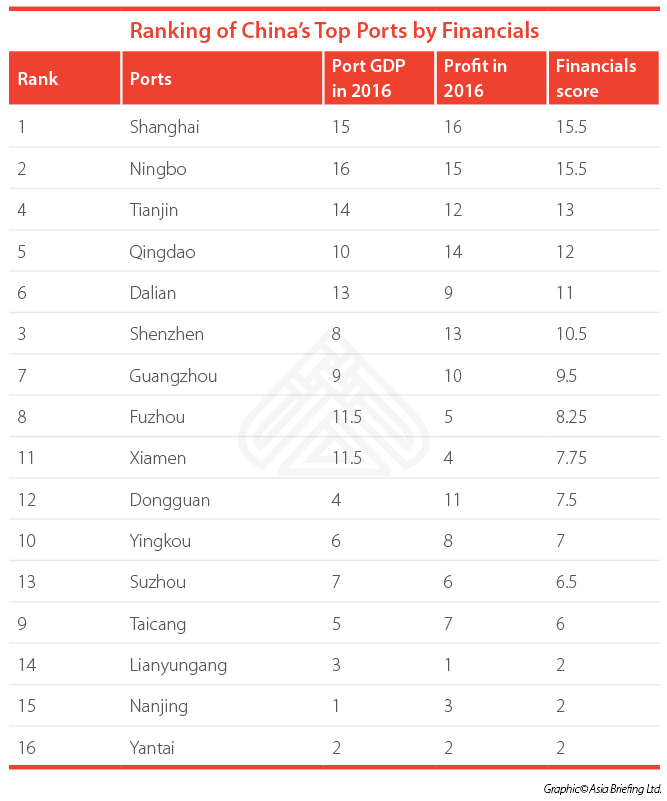
Note: Port GDP is total revenue that the port generated in 2016.
Note: Port GDP is total revenue that the port generated in 2016.
It is interesting to point out that Qingdao ranked highly for both growth and financials. This is because Qingdao’s port is now no longer confined to the loading and unloading business that it has been known for the better part of two decades.
Qingdao has pushed its ports to develop from a simple throughput system to a complex multi-core drive in order to accelerate the development of , including establishing a fund collection management platform, an integrated financial services platform, and a financial advisory platform.
Costs
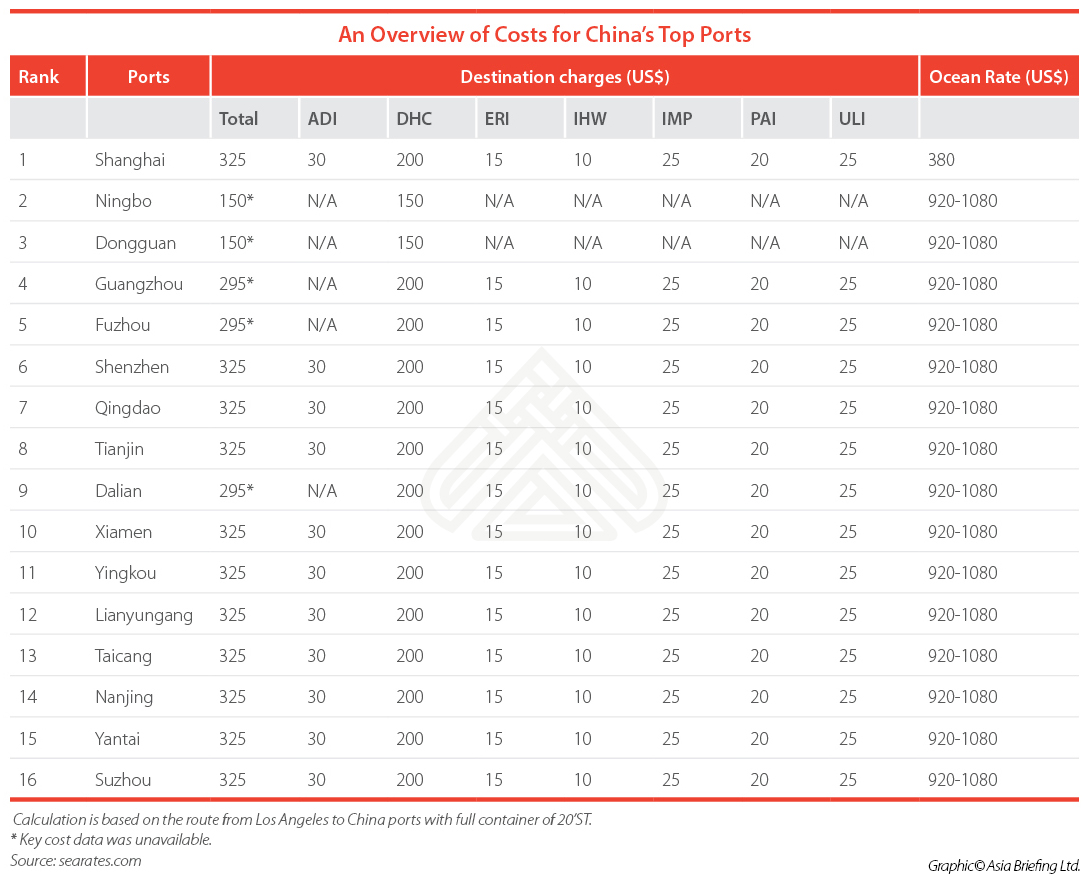
Note:
ADI – Agency Documentation Fee imports
DHC – Destination Terminal Handling Service
ERI – Ecological and Radiological Service
IHW – Inland Haulage Container Weighing
IMP – Import Service
PAI – Ports Additional / Ports Dues – import
ULI – Agency Logistic Fee Import
Ocean Rates – trading and transferring fees
Due to intensive standardization, the cost of shipping containers are fairly similar across all ports. As such, cost was not included in the scoring for the Index, and instead are represented above in its table format for reference.
![]() Business Intelligence Services from Dezan Shira & Associates
Business Intelligence Services from Dezan Shira & Associates
Looking ahead: developments for China’s top ports
Shanghai port has been able to take advantage of preferential policies since becoming China’s first FTZ in 2013. The Shanghai Pilot FTZ continues to be China’s leading area for policy experimentation and reform.
However, there are now a total of 11 FTZs, and each of their unique policies will undoubtedly attract interest to the ports, particularly Tianjin, Guangdong, and Fujian, as well as the newly announced FTZs in Zhejiang and Liaoning. Investors may expect shorter waiting periods, preferential trading or industry policies, and easier clearance for these newly announced areas and the ports nearby.
About Us
China Briefing is produced by Dezan Shira & Associates. The firm assists foreign investors throughout Asia from offices across the world, including in Dalian, Beijing, Shanghai, Guangzhou, Shenzhen, and Hong Kong. Readers may write to china@dezshira.com for more support on doing business in China.
- Previous Article China Releases New Medical Device Classification Catalogue
- Next Article Selling to China Without a Physical Presence: How to Open an Online Shop on Tmall Global


